Tea is the largest individual product heading in Kenya's export profile in the data behind Tradle Daily. Cut flowers, coffee and fruit also feature prominently. That combination is a much better clue than coffee alone.
There is a less obvious entry near the top: refined petroleum. It is a useful reminder that a country's exports describe goods leaving it, not simply things grown or extracted there.
Kenya's biggest export headings
The game dataset records $8.70bn in Kenya's merchandise exports in 2024. These are the six largest HS4 product headings, with names shortened for readability.
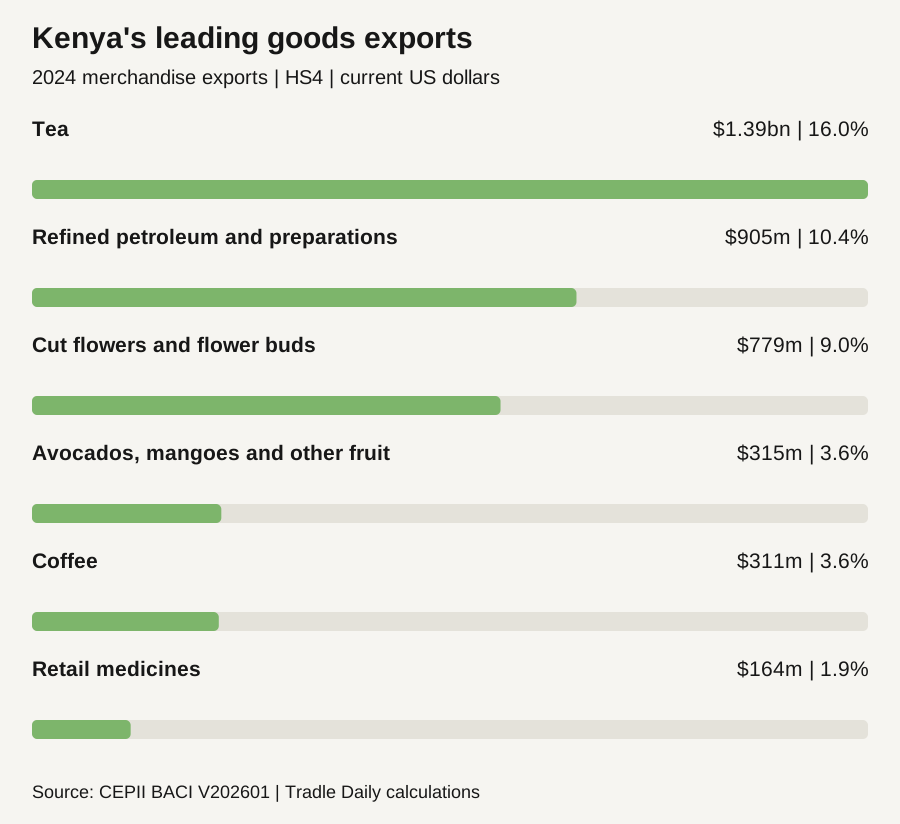
| Export heading | HS4 | Export value | Share of goods exports |
|---|---|---|---|
| Tea | 0902 | $1.39bn | 16.0% |
| Refined petroleum and preparations | 2710 | $905m | 10.4% |
| Cut flowers and flower buds | 0603 | $779m | 9.0% |
| Avocados, mangoes and other fruit | 0804 | $315m | 3.6% |
| Coffee | 0901 | $311m | 3.6% |
| Retail medicines | 3004 | $164m | 1.9% |
Why tea and flowers belong in the same picture
Kenya sits across the equator, but latitude only tells part of its agricultural story. Altitude changes the conditions considerably. The Tea Board of Kenya describes tea-growing highlands on both sides of the Rift Valley, with suitable soils and rainfall supporting cultivation. The relevant geography is the highland landscape, rather than a single nationwide climate. Tea Board of Kenya: industry background
The export table gives that geography an economic shape. Tea makes up about 16% of the country's merchandise export value in this dataset, while cut flowers add roughly 9%. Coffee is important, but its share is much smaller than tea's. Remembering the relative sizes is more useful for the game than remembering that Kenya grows all three.
Fruit supplies another clue, with an important qualification. HS 0804 groups avocados and mangoes with dates, figs, pineapples, guavas and mangosteens. You cannot take the entire value of that heading and call it Kenya's avocado exports. The broader label in the table is deliberate.
What is petroleum doing in the chart?
The second-largest heading covers petroleum oils other than crude, including preparations. It is a different customs heading from crude petroleum, HS 2709.
This export table alone cannot tell us how much of a product was made locally, imported and subsequently re-exported, or processed using imported materials. It also does not tell us the domestic value added. A large petroleum rectangle is therefore not enough evidence to classify Kenya as a major oil-producing economy.
This is a practical lesson for Tradle: inspect the surrounding products before committing to an interpretation. Petroleum alongside tea and flowers tells a different story from petroleum alongside a huge crude-oil block and large polymer exports.
How to recognise Kenya in an export puzzle
Look first for tea, then check for cut flowers. Coffee and fruit strengthen the agricultural pattern. Smaller manufactured products, such as retail medicines and cement, are worth reading too; they stop the profile from being just a list of crops.
No single label identifies a country with certainty. Tea also appears in other export economies, and flowers are not unique to Kenya. It is their combined scale, alongside the rest of the basket, that makes the case. Our guide to reading Tradle clues explains how to use that second and third clue.
About the figures
The chart and table use Tradle Daily's processed CEPII BACI V202601, HS22, 2024 data. Values are current US dollars, rounded for display. BACI reconciles reported bilateral trade, so its totals can differ from national publications. These are goods exports, not GDP or a count of domestic production; services are excluded. BACI source and methodology. Adapted under the Etalab Open Licence 2.0.