Brazil leads the 2024 coffee export-value ranking in our dataset, at about $11.74 billion. Vietnam comes next at $4.15 billion. Then the list takes a turn that might surprise you: Switzerland appears ahead of Colombia.
That doesn't mean Switzerland grows more coffee than Colombia. It means we need to be precise about what we are counting.
This ranking measures exports in US dollars under a particular trade heading. It does not rank harvests, bags of beans or cups of coffee drunk.
The leading coffee exporters by value
We calculated the following from the same processed CEPII BACI data that powers Tradle Daily. It covers the 2024 calendar year and uses HS heading 0901.
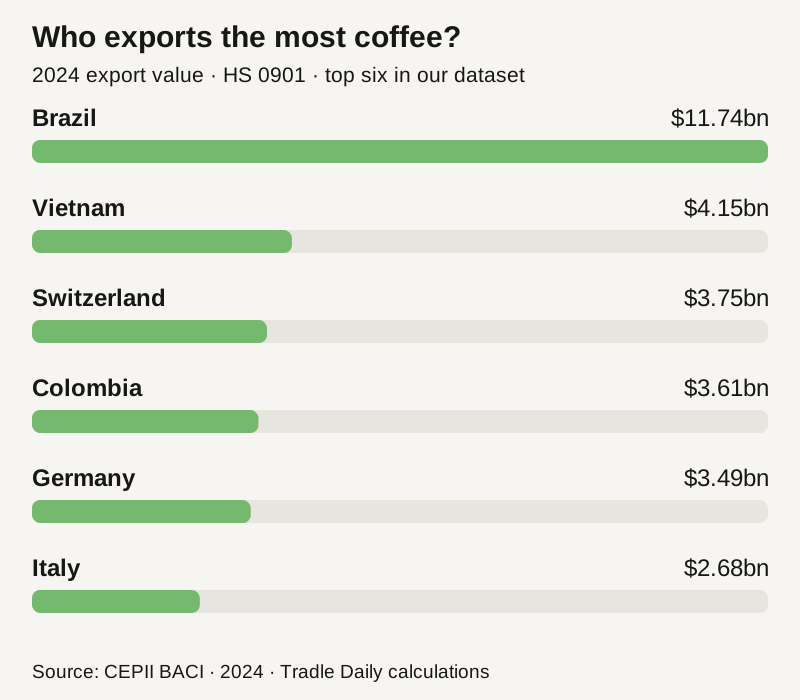
| Rank in our dataset | Country | 2024 coffee exports |
|---|---|---|
| 1 | Brazil | $11.74bn |
| 2 | Vietnam | $4.15bn |
| 3 | Switzerland | $3.75bn |
| 4 | Colombia | $3.61bn |
| 5 | Germany | $3.49bn |
| 6 | Italy | $2.68bn |
| 7 | Indonesia | $1.66bn |
| 8 | Uganda | $1.47bn |
| 9 | Ethiopia | $1.46bn |
| 10 | Honduras | $1.35bn |
Our processed country coverage is narrower than the full BACI exporter universe, so this table is explicitly a ranking within those 204 profiles. It is not a claim that we have reproduced every exporter in the source database.
What counts as coffee here?
HS 0901 includes coffee whether roasted or unroasted, and whether decaffeinated or not. It also includes coffee husks and skins, and coffee substitutes containing coffee.
It does not include instant coffee extracts, which fall under heading 2101. It also isn't the broader chapter 09 total, which includes tea, maté and spices. Using either of those instead would change what the numbers mean.
For a question such as “which country exports the most green coffee beans?”, the right next step would be to use the more detailed HS6 codes. Our HS4 game data combines several forms, so it cannot answer that narrower question on its own.
Why value and volume can give different rankings
Imagine one exporter selling 100 tonnes at $4,000 a tonne and another selling 60 tonnes at $8,000 a tonne. The first ships more coffee. The second earns more export revenue: $480,000 rather than $400,000.
Those are invented numbers, but they show the distinction. Differences in the product, processing and price can change a value ranking without changing which country ships the most weight.
If you are interested in physical coffee flows, the International Coffee Organization's statistics are a useful next stop. Its reporting distinguishes forms of coffee, and coffee-market reports often use 60-kilogram bags or green-bean equivalents. Check the period as well: a coffee year is not necessarily a January-to-December calendar year.
Why do Switzerland, Germany and Italy appear?
An export is a shipment leaving a country. A bean can be grown in one country, imported into another, roasted or otherwise processed, and exported again. Counting the second shipment is correct for trade statistics, but it doesn't identify where the bean grew.
Our table alone doesn't tell us how much of each country's figure is roasted coffee, unroasted coffee or another part of heading 0901. That needs a more detailed breakdown. It does show why an export ranking should never be relabelled as a list of coffee-growing countries.
There is a related lesson in Switzerland's gold exports: countries can play important processing and trading roles in a product's journey.
What this means when you are guessing a country
A coffee block is a helpful clue, but look at its neighbours. Is the rest of the chart agricultural, or is coffee a small part of a much wider industrial basket? What is the total value of exports?
Also separate being a major coffee exporter from depending heavily on coffee exports. Those require different calculations. A country can sell a great deal of coffee while coffee remains a small share of its overall exports. In a smaller export basket, a lower dollar figure could fill much more of the treemap.
That is why memorising the top name in this table only takes you so far. For a puzzle, the mix and the proportions matter as much as the ranking. Our treemap guide shows how to combine those clues before making a guess.
Data and reproducibility
Source: CEPII BACI, HS22, 2024, V202601. For each included exporter we sum HS 0901 trade values across destinations, then sort by current US-dollar value. The preprocessing rounds values to whole dollars. Download the ranking and exact values.
The dataset is adapted under the Etalab Open Licence 2.0. Reference: Gaulier and Zignago (2010), BACI: International Trade Database at the Product-Level, CEPII Working Paper 2010-23. The figures describe 2024, not current prices or a forecast.