If you were guessing a country from its exports, gold might send your thoughts towards a mining economy. Switzerland is a good reason to pause before making that guess.
The short answer is that Switzerland is a major centre for refining and trading gold. An export records metal leaving the country. It does not tell you that the metal was dug out of the ground there.
The Swiss National Bank's April 2025 analysis identifies refining and trading as the reason gold is so prominent in Swiss imports and exports.
What the numbers look like
In the 2024 BACI data used by Tradle Daily, Switzerland exported about $106.38 billion under the HS4 gold heading 7108. That was approximately 26.7% of its $398.80 billion in merchandise exports in our processed dataset.
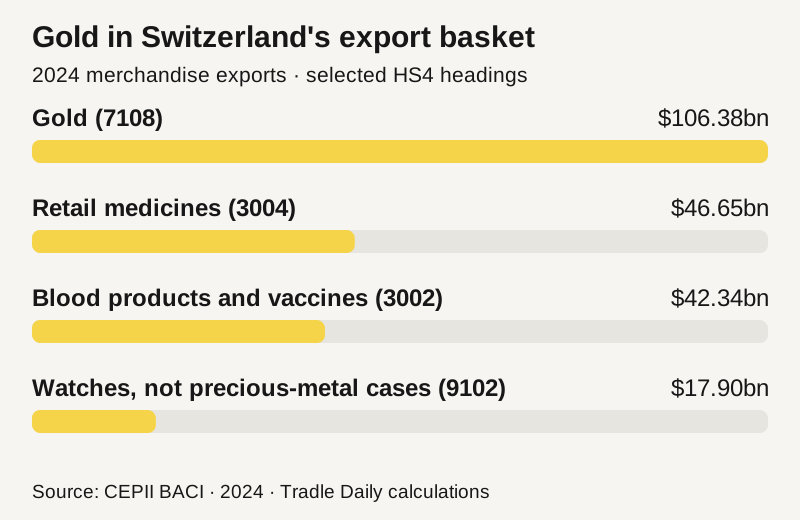
These numbers describe a specific customs heading: gold in unwrought, semi-manufactured or powder form, including gold plated with platinum. Gold jewellery is recorded separately. So are watches with precious-metal cases. Adding those together without saying so would answer a different question.
Follow the material, not just the border
A useful simplified journey is: gold arrives, is refined or processed, and leaves for another buyer. The value recorded on departure includes the gold itself, not just the work carried out in Switzerland.
The Swiss Precious Metals Institute points to the country's concentration of major refineries, its financial centre and the historical involvement of banks in refining. Those connections help explain how a specialised industry can become established in a country without a matching domestic mining sector.
That makes an export chart a record of a country's role in a supply chain. Sometimes that role is extraction. Sometimes it is processing, distribution or trade. The chart alone does not separate those possibilities for you.
Does that mean a quarter of Switzerland's economy is gold?
No. The 26.7% figure is a share of the goods exports in this dataset, not a share of GDP, employment or household income.
Consider an imaginary processor that buys a material abroad for $90 and sells the processed product abroad for $100. Its exports are $100. The difference between those two prices is $10, before accounting for other inputs and costs. The full export value is not all newly created domestic value.
That example isn't an estimate of gold-refining margins. It simply shows why a large export flow and a large contribution to GDP are different claims.
Prices matter too. An increase in a commodity's dollar export value can reflect a higher price, more material shipped, or both. A chart of dollar values cannot settle that question without quantity and price information.
The SNB also cautions that gold flows can move with international demand for safe assets, affecting Swiss external-sector indicators without a corresponding change in the underlying domestic economy. That is another reason to avoid reading one large rectangle as the whole story.
The useful clue is what sits beside the gold
For a country guessing game, the rest of the basket matters. In our Swiss data, large headings include retail medicines, blood products and vaccines, watches, and jewellery.
That combination gives you more to work with than gold alone. If a chart contains both a substantial gold heading and substantial pharmaceutical and watch headings, Switzerland belongs on your shortlist. It is a hypothesis to test, not a rule that every gold-heavy puzzle must obey.
The same habit helps with less obvious examples. Our coffee exporter ranking also includes countries that you might not first associate with growing the crop. Trade often tells you what happens to a product after it leaves the place where it began.
Data and sources
Chart and percentages: our aggregation of CEPII BACI, HS22, 2024, V202601. Values are summed across destinations at HS4 level and may differ from national releases that use different coverage or methods. Download the underlying figures.
BACI is adapted under the Etalab Open Licence 2.0. Reference: Gaulier and Zignago (2010), BACI: International Trade Database at the Product-Level, CEPII Working Paper 2010-23. The SNB and Swiss Precious Metals Institute sources linked above explain the refining and trading context; neither endorses this game.